At a glance: what you'll set up and what it solves
At a Glance: Time: 2–4 hours · Prereqs: Python 3.11+, LangGraph 0.2+, OpenTelemetry SDK 1.25+, an OTLP-compatible collector (Arize Phoenix, Grafana Tempo, Jaeger, or Datadog) · Hardware: any machine running your agent service · Cost: Phoenix OSS is free to self-host; managed Phoenix or Honeycomb billing is usage-based
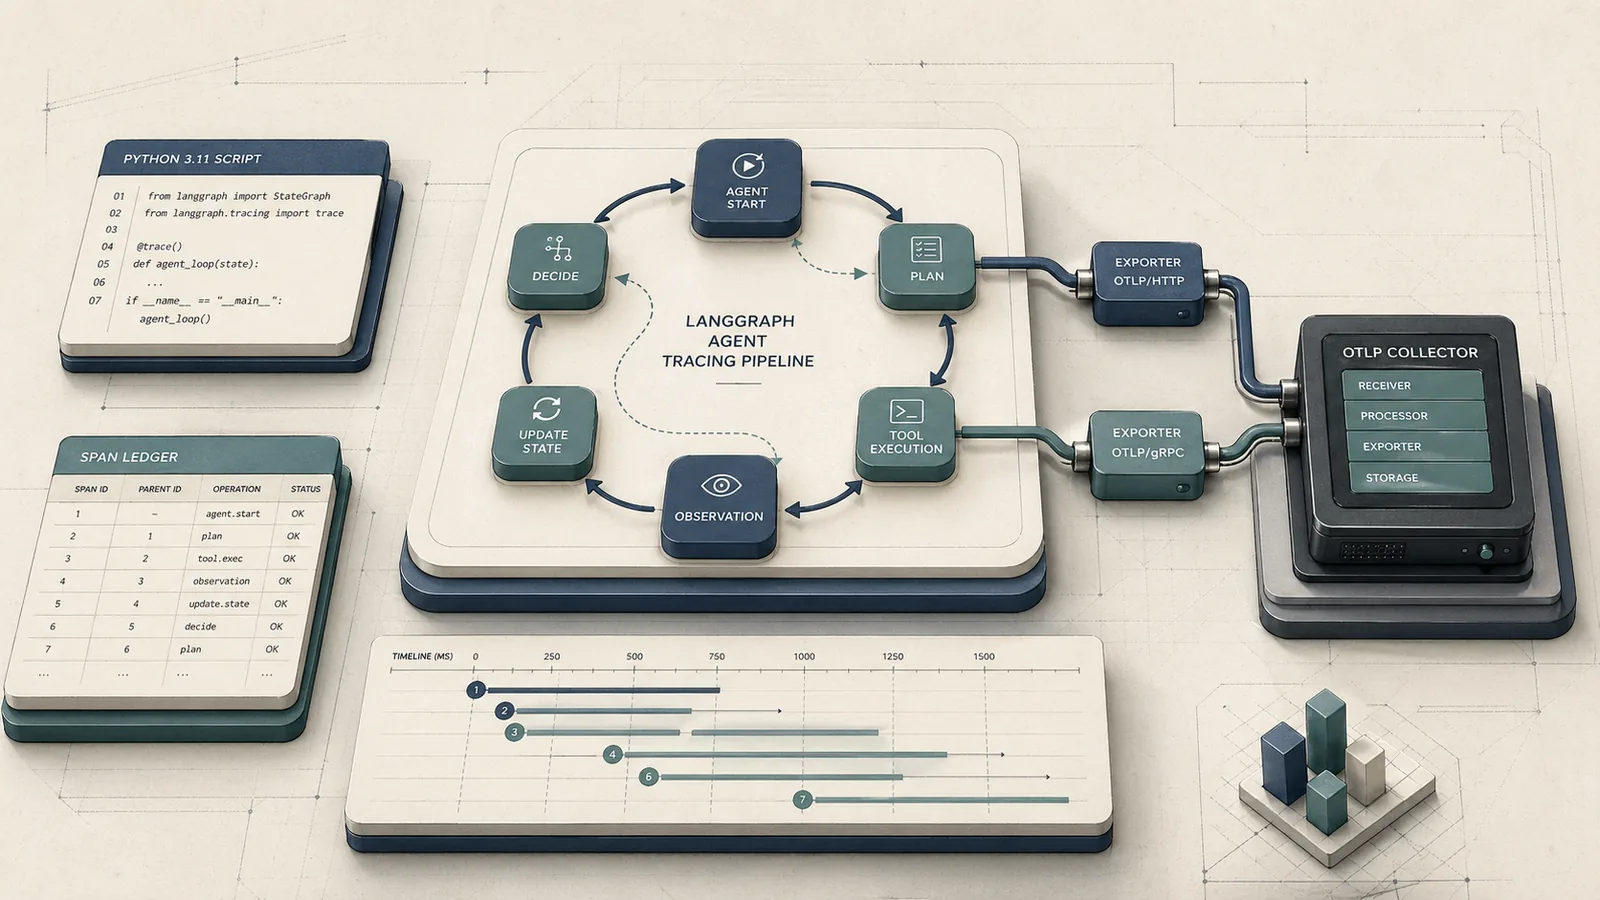
LangGraph describes itself as a framework to "build resilient language agents as graphs." That graph-native, cyclic execution model is exactly what breaks standard APM tracing. When an agent node calls back into the graph — re-invoking the planner after a tool call, looping until a condition is satisfied — OpenTelemetry auto-instrumentation loses track of the active span context. The child span for the second loop iteration has no parent. Your Datadog flame graph shows a forest of disconnected root spans instead of a single coherent trace for the full agent run.
Manual span wrapping addresses this by explicitly starting a child span at each node entry, propagating the active context through LangGraph's state object, and closing the span on node exit — even when the graph cycles back through the same node multiple times. OpenTelemetry's Python docs are direct about this: "You'll then use the SDK to initialize OpenTelemetry and the API to instrument your code." Auto-instrumentation covers supported libraries; it does not capture bespoke graph state updates and recursive control flow inside StateGraph nodes.
The result of this guide: every agent run produces a single parent trace, every node execution is a correctly nested child span, and your collector (whether local Phoenix, Grafana Tempo, or a managed backend) receives a complete picture of token consumption, latency per node, and the exact decision path that led to a wrong answer or a $400 overnight bill.
Prerequisites, versions, and local observability stack
Yes — OpenTelemetry works with LangGraph, but only through manual instrumentation. The auto-instrumentation hooks that cover frameworks like requests, sqlalchemy, or fastapi have no awareness of LangGraph's StateGraph execution model. You wire them together yourself using the OpenTelemetry Python SDK.
Minimum versions required:
- Python 3.11+
- LangGraph 0.2+
- OpenTelemetry SDK 1.25+ (
opentelemetry-sdk,opentelemetry-api) - An OTLP exporter package (gRPC or HTTP — details in the next section)
For a local observability stack during development, Arize Phoenix is the most practical option. Phoenix is "built on top of OpenTelemetry and is powered by OpenInference instrumentation" and "traces AI applications, via OpenTelemetry." It runs as a local server, accepts OTLP over HTTP, and renders LLM-specific span attributes (token counts, model names, prompt/completion payloads) without custom dashboarding work. For production, Grafana Tempo, Jaeger, Honeycomb, Cloud Trace, and Datadog all accept standard OTLP and work identically from the SDK's perspective.
The OTLP exporter packages ship separately from the core SDK:
$ pip install opentelemetry-sdk opentelemetry-api \
              opentelemetry-exporter-otlp-proto-grpc \
              opentelemetry-exporter-otlp-proto-http \
              langgraph>=0.2
Configure your exporter endpoint via environment variables before running your agent. The OpenTelemetry OTLP exporter configuration docs define the canonical variable names:
# For OTLP/HTTP (Phoenix, Grafana Tempo, Honeycomb)
OTEL_EXPORTER_OTLP_TRACES_ENDPOINT: "http://localhost:6006/v1/traces"
OTEL_SERVICE_NAME: "langgraph-agent"

# For OTLP/gRPC (Jaeger, Datadog Agent, self-hosted OTel Collector)
OTEL_EXPORTER_OTLP_ENDPOINT: "http://localhost:4317"
OTEL_SERVICE_NAME: "langgraph-agent"

# Arize Phoenix-specific collector endpoint variable
PHOENIX_COLLECTOR_ENDPOINT: "http://localhost:6006"
Why automatic instrumentation misses LangGraph state transitions
Standard auto-instrumentation attaches to library hooks — HTTP clients, database drivers, framework middleware. It knows nothing about LangGraph's StateGraph dispatch loop because that loop is application logic, not a library boundary.
LangGraph executes nodes as callables registered on the graph. The runtime invokes them in sequence or cycles based on conditional edges, passing a shared state dict between nodes. From OpenTelemetry's perspective, each node invocation is an ordinary Python function call. No HTTP request is made, no database query fires — so no auto-instrumentation hook triggers. The span context from the initiating graph.invoke() call is not automatically threaded into each node's execution scope.
The LangGraph GitHub repository acknowledges this tracing gap: it points users toward LangSmith for "Debugging with LangSmith — Gain deep visibility into complex agent behavior with visualization tools that trace execution paths, capture state transitions, and provide detailed runtime metrics." LangSmith solves this for LangChain's own tracing backend, but it does not emit OTLP-compatible spans to your existing APM infrastructure. Every vendor-dashboard-focused guide stops here and tells you to use LangSmith. This guide does not.
Pro Tip: The span-orphaning problem has a precise cause: OpenTelemetry stores the active span in a
contextvars.ContextVar. When LangGraph's scheduler invokes a node in a new call frame — particularly after a conditional edge or a recursive cycle — Python's context variable does not automatically carry forward unless you explicitly attach it. The second loop iteration sees no parent span in its local context and starts a new root trace. You capture the span context before the node call and attach it inside the node callable usingopentelemetry.context.attach(). Vendor dashboards that wrap LangSmith sidestep this entirely by using LangSmith's own callback system, which is why their guides never show OTLP context propagation code.
Step 1: Install the Python packages and exporter dependencies
Install the four packages you need for manual tracing: the OTel API, the OTel SDK, your chosen exporter, and LangGraph itself.
$ pip install \
    "opentelemetry-api>=1.25.0" \
    "opentelemetry-sdk>=1.25.0" \
    "opentelemetry-exporter-otlp-proto-grpc>=1.25.0" \
    "opentelemetry-exporter-otlp-proto-http>=1.25.0" \
    "langgraph>=0.2"
OpenTelemetry's Python exporter docs document both transport packages explicitly: opentelemetry-exporter-otlp-proto-grpc for OTLP/gRPC and opentelemetry-exporter-otlp-proto-http for OTLP/HTTP. Install both during development if you haven't decided on a transport yet — the SDK initializer switches between them in one line.
LangGraph's release history includes a patch noted in the repository release notes that addressed a handler type-checking issue affecting tracing integrations. Confirm your installed version is at least 0.2 and re-verify your tracing snippet against the installed version before shipping to production, since instrumentation-facing behavior can shift across minor releases.
Choose OTLP gRPC or OTLP HTTP before you write code
The transport choice affects only your exporter initialization code. The tracing logic — span creation, context propagation, attribute setting — is identical for both paths.
# OTLP/HTTP — recommended for Phoenix, Grafana Tempo, Honeycomb, firewall-constrained environments
OTEL_EXPORTER_OTLP_TRACES_ENDPOINT: "http://localhost:6006/v1/traces"
# Note: OTLP/HTTP endpoint "typically ends with v1/traces" (OTel OTLP exporter config docs)

# OTLP/gRPC — recommended for Jaeger, Datadog Agent, self-hosted OTel Collector on same network
OTEL_EXPORTER_OTLP_ENDPOINT: "localhost:4317"
# gRPC uses host:port only; no /v1/traces suffix

# Phoenix-specific variable (resolves to the same HTTP endpoint)
PHOENIX_COLLECTOR_ENDPOINT: "http://localhost:6006"
Prefer gRPC when your agent service and the collector live on the same cluster network and you control both ends — it carries lower per-span overhead at high throughput. Prefer OTLP/HTTP when you're crossing a firewall, proxying through a load balancer, or sending to Arize Phoenix, which accepts OTLP over HTTP. Phoenix does not require the gRPC package at all.
Step 2: Create a tracer provider and resource attributes
Initialize the tracer provider once at application startup, before any graph execution. Every span your nodes create derives from this provider.
import os
from opentelemetry import trace
from opentelemetry.sdk.trace import TracerProvider
from opentelemetry.sdk.trace.export import BatchSpanProcessor
from opentelemetry.sdk.resources import Resource
from opentelemetry.exporter.otlp.proto.http.trace_exporter import OTLPSpanExporter

def init_tracer_provider() -> trace.Tracer:
    # service.name groups all spans from this agent service in the backend
    resource = Resource.create({
        "service.name": os.getenv("OTEL_SERVICE_NAME", "langgraph-agent"),
        "service.version": "1.0.0",
        "deployment.environment": os.getenv("DEPLOYMENT_ENV", "development"),
    })

    exporter = OTLPSpanExporter(
        endpoint=os.getenv("OTEL_EXPORTER_OTLP_TRACES_ENDPOINT", "http://localhost:6006/v1/traces")
    )

    provider = TracerProvider(resource=resource)
    # BatchSpanProcessor is the production default: buffers and flushes spans
    # asynchronously, reducing per-span latency impact on the agent runtime
    provider.add_span_processor(BatchSpanProcessor(exporter))
    trace.set_tracer_provider(provider)

    return trace.get_tracer("langgraph.agent")

TRACER = init_tracer_provider()
The BatchSpanProcessor is the recommended production choice — it buffers spans and flushes them in background batches rather than blocking each node call. Set service.name explicitly; without it, most backends (Phoenix, Tempo, Datadog) group your traces under "unknown_service", making multi-service environments unreadable.
Step 3: Wrap StateGraph nodes with manual spans
Each node in your StateGraph becomes a traced unit by wrapping its callable with a context manager that starts a child span, executes the node body, and closes the span on exit — whether the node returns normally or raises.
import functools
from opentelemetry import trace, context
from opentelemetry.trace import SpanKind
from typing import Callable, Any

def traced_node(node_name: str) -> Callable:
    """Decorator that wraps a LangGraph node function with an OTel child span."""
    def decorator(fn: Callable) -> Callable:
        @functools.wraps(fn)
        def wrapper(state: dict, *args, **kwargs) -> Any:
            # Retrieve the parent context stored in the state dict;
            # this is the key mechanism that survives recursive cycles
            parent_ctx = state.get("__otel_ctx__", context.get_current())

            with TRACER.start_as_current_span(
                name=f"node.{node_name}",
                context=parent_ctx,
                kind=SpanKind.INTERNAL,
            ) as span:
                span.set_attribute("langgraph.node.name", node_name)
                span.set_attribute("langgraph.state.keys", str(list(state.keys())))

                result = fn(state, *args, **kwargs)

                # Persist the current span's context into the outgoing state
                # so the next node — including recursive re-entries — inherits it
                if isinstance(result, dict):
                    result["__otel_ctx__"] = context.get_current()
                return result
        return wrapper
    return decorator
Apply the decorator when registering nodes on the graph:
from langgraph.graph import StateGraph, END

@traced_node("planner")
def planner_node(state: dict) -> dict:
    # your planner logic here
    return {**state, "plan": "..."}

@traced_node("executor")
def executor_node(state: dict) -> dict:
    # your executor logic here
    return {**state, "result": "..."}

graph = StateGraph(dict)
graph.add_node("planner", planner_node)
graph.add_node("executor", executor_node)
graph.set_entry_point("planner")
graph.add_edge("planner", "executor")
graph.add_conditional_edges("executor", lambda state: "planner" if not state.get("done") else END)
compiled = graph.compile()
Map each node transition to a parent span
The __otel_ctx__ example key in the state dict is what prevents orphaned spans across recursive cycles. Without it, each re-entry into planner_node calls context.get_current() and finds an empty context — because LangGraph's scheduler dispatches the node in a fresh call frame where no span has been attached. The result: every cycle iteration creates a new root span.
from opentelemetry import context as otel_context

def start_root_trace(graph, initial_state: dict) -> dict:
    """Start a root span for the full agent run and inject its context into state."""
    with TRACER.start_as_current_span("agent.run", kind=SpanKind.SERVER) as root_span:
        root_span.set_attribute("agent.run.id", initial_state.get("run_id", "unknown"))

        # Capture the current context (which now contains root_span) and
        # inject it into state before graph execution begins
        initial_state["__otel_ctx__"] = otel_context.get_current()

        final_state = graph.invoke(initial_state)

        # root_span closes here, after all nodes have completed
    return final_state
When planner_node fires for the first time, state["__otel_ctx__"] contains the root span's context. The child span it creates is correctly parented. When executor_node completes and returns result["__otel_ctx__"] = context.get_current(), that value carries the executor's span context. On the next cycle, planner_node reads it again and creates its child span under executor — giving you a chain that maps the exact execution path: agent.run → node.planner → node.executor → node.planner → node.executor → ....
OpenTelemetry's Python cookbook documents nested span creation as the standard mechanism for this kind of manual lineage. The critical rule: always derive the child span from the currently active span before invoking the next node; detached spans are the primary cause of orphaned traces.
Attach node-specific attributes for debugging and cost analysis
Span attributes are what make traces actionable in Phoenix or any OTLP backend. A span that says node.planner ran in 1.2 seconds is interesting; a span that says it consumed 847 prompt tokens using gpt-4o and is on cycle 3 of 7 is debuggable.
def attach_llm_attributes(span: trace.Span, node_name: str, state: dict,
                           model: str, prompt_tokens: int,
                           completion_tokens: int, cycle: int) -> None:
    """Attach LLM-specific attributes to a node span for cost and debug analysis."""
    span.set_attribute("langgraph.node.name", node_name)
    span.set_attribute("langgraph.cycle.index", cycle)
    span.set_attribute("llm.model_name", model)
    span.set_attribute("llm.usage.prompt_tokens", prompt_tokens)
    span.set_attribute("llm.usage.completion_tokens", completion_tokens)
    span.set_attribute("llm.usage.total_tokens", prompt_tokens + completion_tokens)
    # state version helps correlate which state snapshot produced a given LLM call
    span.set_attribute("langgraph.state.version", state.get("version", 0))
OpenTelemetry's Python instrumentation docs explicitly support manual span attributes ("Manual Span Attributes"). Arize Phoenix's tracing layer renders llm.usage.* and model name attributes natively in its trace detail view, making token cost analysis immediate without custom dashboard configuration. Keep attribute cardinality under control: use static node names and model identifiers, not per-request UUIDs, as attribute keys — high-cardinality keys drive up trace storage costs in every backend.
Step 4: Export traces to an OTLP-compliant collector
With your tracer provider initialized in Step 2, export configuration reduces to setting the correct endpoint and confirming the exporter class matches the transport.
# OTLP/HTTP export — works with Phoenix, Grafana Tempo, Honeycomb
from opentelemetry.exporter.otlp.proto.http.trace_exporter import OTLPSpanExporter as HTTPExporter

http_exporter = HTTPExporter(
    endpoint="http://localhost:6006/v1/traces",  # Phoenix local default
    # headers={"api-key": os.getenv("PHOENIX_API_KEY")}  # for managed Phoenix
)

# OTLP/gRPC export — works with Jaeger, Datadog Agent, self-hosted OTel Collector
from opentelemetry.exporter.otlp.proto.grpc.trace_exporter import OTLPSpanExporter as GRPCExporter

grpc_exporter = GRPCExporter(
    endpoint="localhost:4317",  # host:port only, no /v1/traces suffix
    insecure=True                      # set False and provide credentials in production
)
OpenTelemetry's OTLP exporter configuration docs confirm: the OTLP/HTTP trace endpoint "typically ends with v1/traces when using OTLP/HTTP," while gRPC uses a bare host:port. Mixing these up — sending an HTTP exporter to a gRPC port or appending /v1/traces to a gRPC endpoint — is one of the most common setup failures; the exporter silently drops spans or throws connection errors at startup.
For Arize Phoenix, set PHOENIX_COLLECTOR_ENDPOINT=http://localhost:6006 and use the HTTP exporter with endpoint http://localhost:6006/v1/traces. Phoenix's FAQ documents PHOENIX_COLLECTOR_ENDPOINT as the canonical variable for its collector address.
Step 5: Verify that spans stay nested across loops
After running a test agent invocation, confirm your tracing is structurally correct using these checks before promoting to production.
| Verification check | Expected result | How to confirm |
|---|---|---|
| Root span exists | Exactly 1 agent.run span per graph.invoke() call |
Phoenix trace list: 1 root row per run |
| Child spans per node | Exactly 1 node.<name> span per node execution |
Phoenix trace detail: indented children under root |
| Recursive cycle nesting | 5 loop iterations appear as children, not new roots | No additional root traces for the same run ID |
| Span count per node | 3 cycles × 2 nodes = 6 spans in the sample run | Query SELECT COUNT(*) WHERE span.name = 'node.planner' |
| Collector receipt | 100% of exported spans confirmed in a test run | BatchSpanProcessor logs show successful export completion |
| Attributes populated | llm.usage.prompt_tokens, langgraph.node.name visible |
Phoenix span detail panel shows all attributes |
Arize Phoenix's trace list view renders "each row in the trace list represents a span, a single unit of work within a trace" and distinguishes agent spans, LLM generation spans, and tool execution spans by kind column. If you see multiple root-level rows for a single agent run, context propagation through __otel_ctx__ has broken somewhere. If node spans are missing entirely, check the BatchSpanProcessor flush interval and confirm the collector endpoint is reachable from your service.
Common failures when tracing recursive agent graphs
Watch Out: Four failure modes account for the majority of broken LangGraph traces in production:
1. Missing context propagation. A node returns a plain
dictwithout updating__otel_ctx__. The next node finds no parent context and opens a new root trace. Every node in your decorator must write the current context into its return value.2. Duplicate spans from double-wrapping. You decorate a node function and add a middleware wrapper in the graph builder. Each invocation generates two
node.<name>spans with the same attributes, one of which is parentless. Instrument exactly one layer.3. Exporter protocol mismatch. Sending an
OTLPSpanExporter(HTTP) to a gRPC port (4317) causes silent connection failures. TheBatchSpanProcessorretries and may log an export failure message, but does not crash the agent. Check logs actively during initial setup.4. Span explosion from tight cycles. An agent graph that loops 200 times per run generates 200+ child spans. At production scale across thousands of concurrent runs, this can saturate your collector's ingest rate and inflate trace storage costs by an order of magnitude. Apply cycle-count limits in graph logic before fixing tracing — unlimited recursion is both a tracing problem and a correctness problem. LangGraph's release notes include a fix for a strict handler type check that was breaking OTel instrumentation, confirming that instrumentation edge cases in cyclic graphs remain an active concern across versions.
Production rollout: sampling, dashboards, and alert thresholds
Production Note: Before enabling full-trace collection at production request volume, configure these three controls:
Sampling: Apply a
TraceIdRatioBasedsampler at 10–20% for routine runs. Retain 100% of traces wherellm.usage.total_tokens > 5000or where the run ID matches an error report. OpenTelemetry's SDK supports parent-based and ratio-based samplers without changes to node-level code.Trace retention: Keep 7 days of full trace data in Phoenix or Grafana Tempo for cost debugging; archive span attribute aggregates (token sums, cycle counts) to a cheaper store for 90-day trend analysis.
Alert thresholds (recommended starting points): - Total tokens per run > 8,000 → page on-call (token runaway) - Cycle count per run > 15 → page on-call (potential infinite loop) - Missing child spans for a registered node name → alert (context propagation failure) -
BatchSpanProcessorexport failure rate > 1% → alert (collector connectivity)Arize Phoenix is "built on top of OpenTelemetry" and supports evaluation workflows alongside tracing, making it a practical single pane for both real-time observability and offline LLM quality analysis. For teams already running Grafana stacks, Grafana Tempo with a Prometheus-alerting sidecar achieves equivalent alert coverage using the same OTLP pipeline — backend choice does not alter any of the node instrumentation code above.
Questions readers ask before instrumenting LangGraph
Do I have to choose between LangSmith and OpenTelemetry?
No. LangSmith uses LangChain's callback system to capture state transitions and is the fastest path to agent-level debugging within the LangChain ecosystem. The LangGraph repository explicitly lists "LangSmith — Helpful for agent evals and observability" as a recommended pairing. The OpenTelemetry path targets your existing APM infrastructure — Datadog, Honeycomb, Grafana — and does not replace LangSmith. Both can coexist: LangSmith callbacks provide LangChain-native introspection, and OTLP spans provide infrastructure-level alerting and multi-service distributed traces.
Will this work with streaming LangGraph runs (graph.astream)?
The same context propagation pattern applies to async node execution. Replace context.get_current() with the async-compatible contextvars approach and ensure your async node functions attach the parent context at the top of each coroutine before awaiting LLM calls.
Does Arize Phoenix require the OpenInference package?
Phoenix's native OpenInference instrumentation adds higher-level semantic conventions for LLM spans. The boilerplate above uses standard OTLP attributes (llm.usage.prompt_tokens, llm.model_name) which Phoenix renders correctly without requiring the OpenInference package. Add OpenInference if you want Phoenix's evaluation pipelines to automatically parse prompts and completions from span attributes.
Pro Tip: Treat your OTLP collector as the source of truth for trace data, keeping backend choice out of application code. Set
OTEL_EXPORTER_OTLP_TRACES_ENDPOINTin your deployment environment and swap between Phoenix, Grafana Tempo, or Datadog by changing one environment variable — no code changes, no re-instrumentation. LangSmith and Arize Phoenix can run concurrently as separate consumers of the same agent telemetry; the collector fan-outs to both.
Sources and references
- LangGraph GitHub Repository — Primary source; LangGraph architecture, StateGraph execution model, LangSmith debugging integration, and OTel-related release notes
- OpenTelemetry Python Manual Instrumentation — SDK initialization, manual span creation, and span attribute APIs
- OpenTelemetry Python Cookbook — Nested span creation and manual context propagation examples
- OpenTelemetry OTLP Exporter Configuration —
OTEL_EXPORTER_OTLP_TRACES_ENDPOINTand related environment variable reference - OpenTelemetry Python Exporters — gRPC and HTTP exporter package installation and BatchSpanProcessor documentation
- Arize Phoenix Tracing Docs — Phoenix OpenTelemetry ingestion, LLM span rendering, and trace list structure
- Arize Phoenix Docs (Overview) — Architecture overview; Phoenix as an OpenTelemetry-native AI observability platform
- Arize Phoenix Collector Endpoint FAQ —
PHOENIX_COLLECTOR_ENDPOINTvariable reference - Arize Phoenix Open Agent Observability Blog — Span kind taxonomy and trace list row structure for agent, LLM, and tool spans
Keywords
Keywords: LangGraph, LangGraph 0.2, OpenTelemetry, OpenTelemetry SDK 1.25, OTLP, OTLP gRPC exporter, OTLP HTTP exporter, manual spans, StateGraph, distributed tracing, Arize Phoenix, parent-child spans, context propagation, LangSmith, Grafana Tempo, Jaeger, Honeycomb, Datadog, Python 3.11, agent observability, LLM tracing, span orphan